Step-by-step guideWebOwner / Admin / Member
Use Views and Pivot
What you will accomplish
You will select the right track and range, apply filters, and build a Pivot that breaks a metric down by dimensions.
Who can do this
All roles with Views and track access can use Pivot. Available metrics and dimensions come from the selected track.
Before you start
A Pivot is a table that breaks a metric down by dimensions. A metric is the value being measured; a dimension groups records into rows or columns.
Set the analysis context
- Select Views.
- Select Pivot.
- Select the Track.
- Select the date Range.
- Open filters and select any needed record conditions.
- Confirm the active rooftop scope.
Build a Pivot
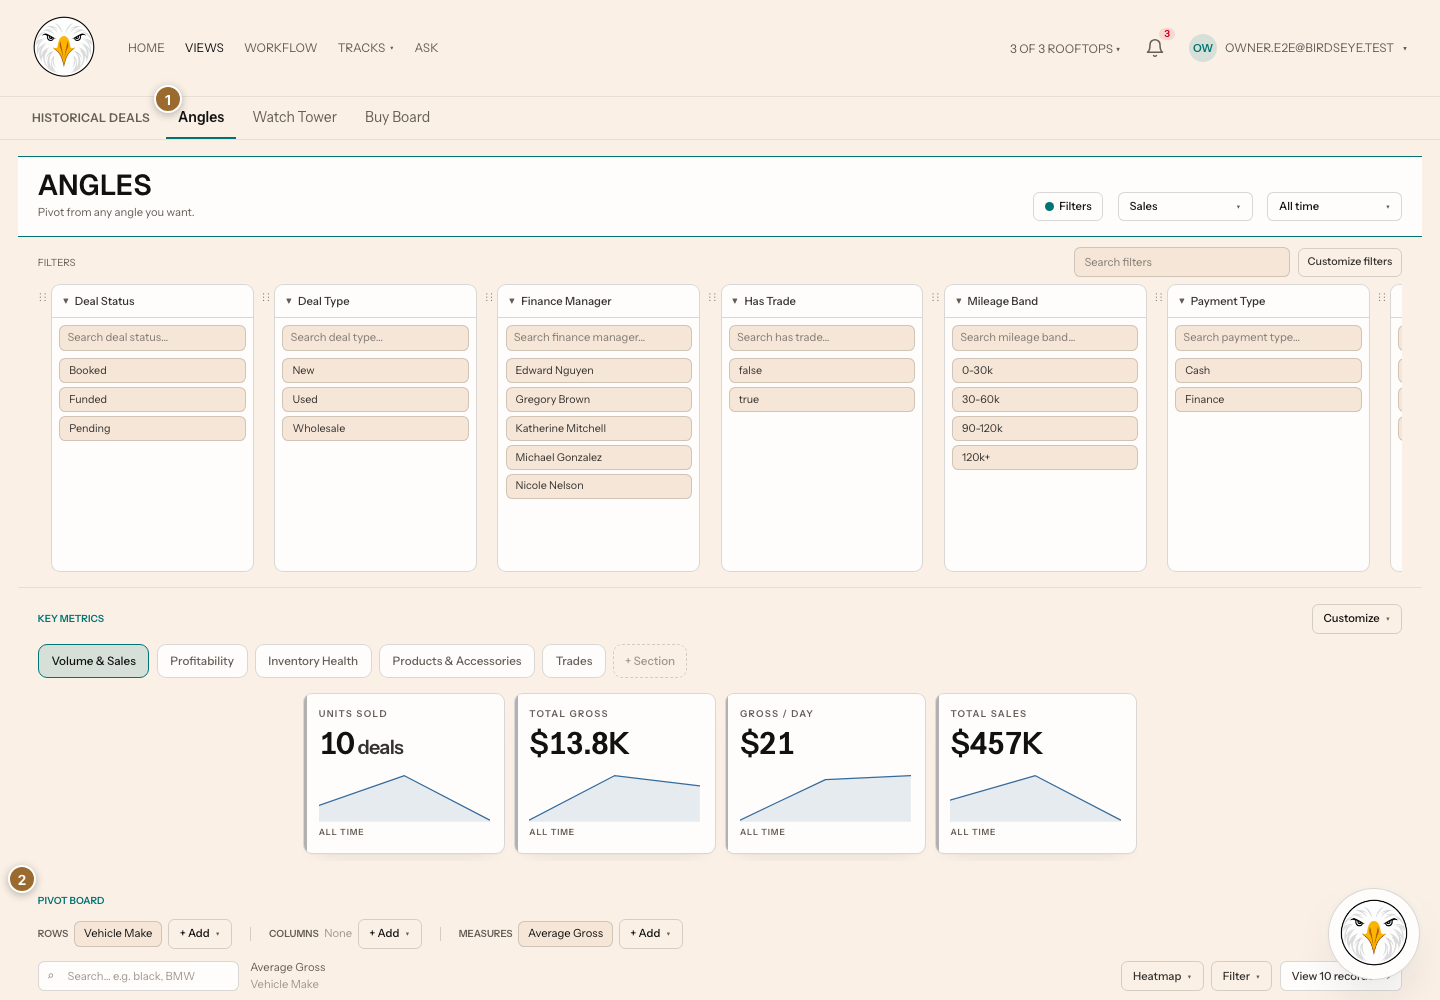
- Select the metric or value to analyze.
- Select the first grouping dimension.
- Select another grouping or pivot control when available.
- Review the resulting rows, columns, totals, or heatmap.
- Select an interactive cell or value to inspect supporting records when available.
Changing the track can clear incompatible controls. Review range and filters after every track change.
Expected result: the Pivot recalculates for the selected track, range, scope, filters, metric, rows, and columns. A missing combination remains empty rather than being invented.
Troubleshooting and recovery
- A metric or dimension is missing: the selected track does not expose a compatible field.
- No results appear: clear filters, widen the range, and confirm scope.
- A total differs from another page: align metric definition, range, scope, and filters.
- You expected Watch Tower: select Watch Tower within Views; there is no retired Board/Tower toggle.
Related articles
Last verified against the product on 2026-07-29.